The past month has been nothing short of vitalizing for me. My project, <Quantum| Chamitas>, embarked on its first face-to-face talk, marking a significant milestone in its journey. As I walk this path, I’ve been diving deeper into preparing educational and technical materials on quantum computing. It’s fascinating how the world of quantum intertwines with our daily lives, and I’m eager to share this knowledge with a broader audience! ☺️ On the administrative front, I’m pleased to report that bureaucratic procedures have been smooth 🙏🏼, paving the way for more exciting professional developments.

As I sit here, reflecting on the whirlwind of the past few weeks, it’s hard to ignore the sense of accomplishment that accompanies exhaustion. Balancing a myriad of responsibilities, from private classes to the quantum computing projects, and even finding time to babysit my energetic godson, life has been a constant juggling act. However, I found solace in the world of data projects. Today, ✅I want to show you one of such project that has allowed me to take an step forward in building my data portfolio. In this short blog post, I invite you to join me on this project after the hours of dedication and passion. So, without further, let’s dive into the captivating world data science!
Decoding Customer Churn
In the vast world of data and telecommunications, there’s a silent game of musical chairs happening. Customers come, customers go, but some leave a bit too soon, creating the intriguing puzzle of customer churn. 🧩 Why do some customers decide to part ways, and what makes others stay? Well, I made the decision to tackle that very question using data as my guiding tool.
So, picture a telecom company in California, bustling with activity, serving thousands. This company is call Telco. While many customers hum along happily, a significant number decide to switch off their connections. 🚨 My objective was clear: Dive into the data, discover patterns, and pinpoint the key factors influencing customer decisions. 🧩 But how does one approach such a vast sea of information?
➡️I decided to use the Chi-squared method and decision trees to decode the mistery. Imagine a decision tree as a wise old sage, guiding you through a forest of data, pointing out patterns and revealing hidden truths. On the other hand, the Chi-squared method is like a detective’s magnifying glass, highlighting the intricate relationships between different factors.
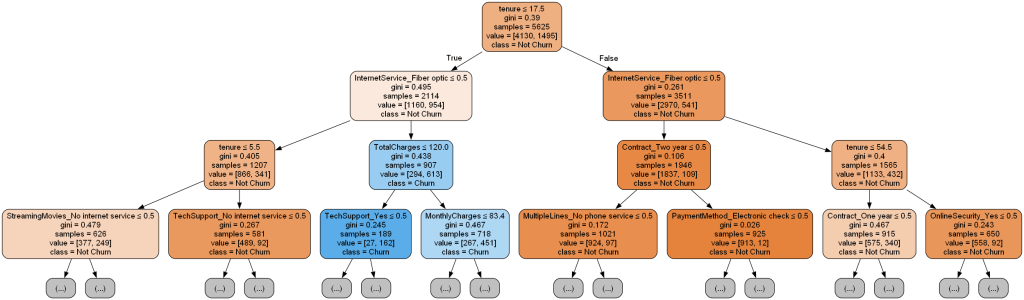
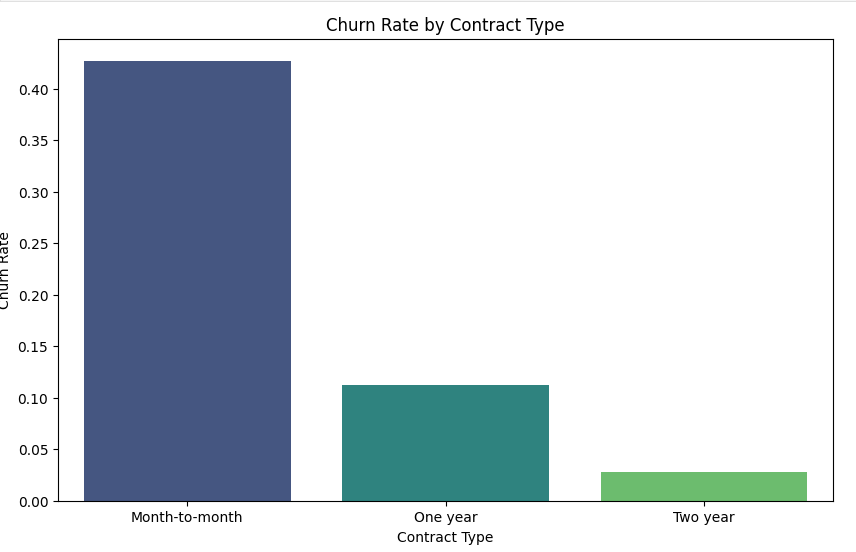
Talking with a bit more of details: ✅A decision tree, in its essence, is a flowchart-like structure where each node represents a feature, each branch represents a decision rule, and each leaf represents an outcome. For my telecom dataset, 💡the decision tree helped visualize the hierarchy of factors influencing churn. On the other hand, ✅ the Chi-squared method was a statistical test used to determine if there’s a significant association between two categorical variables. In my context, 💡it helped validate the relationship between factors like contract type and customer churn.
The Journey
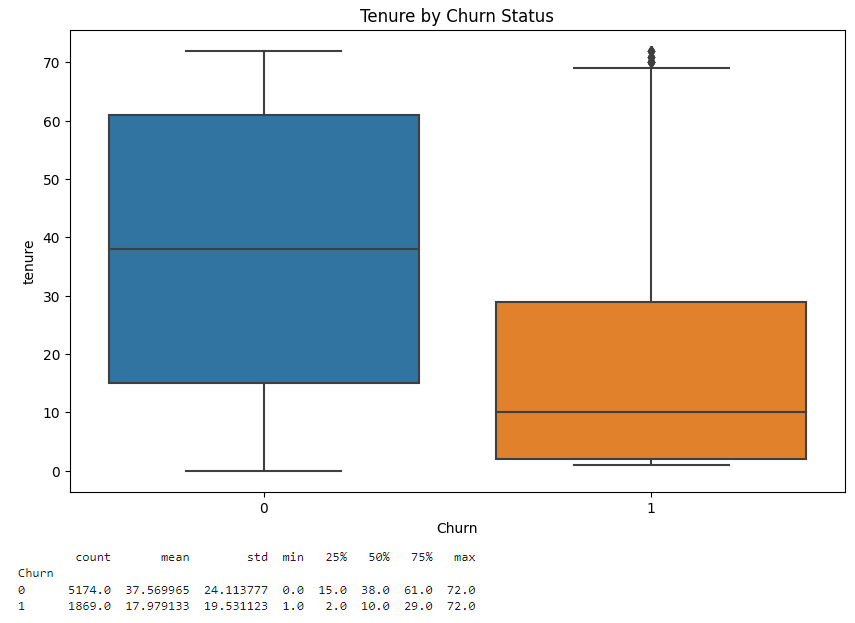
As I delved deeper, the data began to weave a story. 🚨 Tenure, or the duration a customer has been with the company, stood out prominently. It seemed the newer members of the Telco family were more restless, often choosing to explore other horizons. Monthly charges, too, played an importantl role. The type of contract, the services they availed, and even their chosen payment methods contributed to the customers leaving or staying.
💡Some findings were particularly striking. Customers with optical fiber, for instance, were more inclined to churn! 🧩 Was it the digital age’s teething troubles or something more profound? ➡️ Well, customers with fiber optic service who didn’t have TechSupport, StreamingTV, StreamingMovies and OnlineSecurity, had a high churn rate of 49%. This suggested that the absence of these support services might be a significant factor in their decision to leave. These services hold great value for customers, and the optic fiber alone, without these supplementary features, holds limited value.
Every dataset, like a novel, has a narrative waiting to be told (when it is well interpreted, of course 🤣). This exploration was not just about crunching numbers but understanding the subtle dance of business dynamics and human choices. That’s the joy of discovery. Even in customer preferences, there was a story waiting at every turn.
You can find all the intricate details of this analysis in the notebook on my GitHub repository. See you in the next data adventure! 🚀